

This is a tremendous turn-around as reported today from SCI Engineered Materials (OTCQB: SCIA)
Here’s What’s Up:
- EBITDA for Qtr $389,000 – up from $23,000 for same period last year.
- Total revenue for Qtr $3,098,376 compared to $1,792,775
- Gross Profit for Qtr $580,470 compared to $398,191 for same period
- There is more than that… read on
THE FULL RELEASE:
SCI Engineered Materials, Inc. Reports Second Quarter 2014 Results
SCI Engineered Materials, Inc. (“SCI”) (OTCQB: SCIA), a global supplier and manufacturer of advanced materials for physical vapor deposition thin film applications that works closely with end users and OEMs to develop innovative, customized solutions, today reported its financial results for the three months and six months ended June 30, 2014.
Dan Rooney, Chairman, President and Chief Executive Officer, stated, “We are pleased with our performance for the first half of 2014, which significantly improved compared to last year. EBITDA(1) increased to more than $389,000 for the first six months of this year from less than $23,000 for the same period in 2013. Our profitable second quarter results benefited from a substantial increase in revenue and gross profit.”
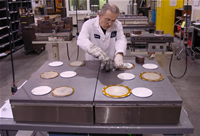
Advanced in-house bonding capabilities allow SCI to bond many different materials.
“Several new customers are currently conducting extensive product testing and qualification activities. We are optimistic this will result in increased orders during the second half of 2014. Backlog was $2.2 million at June 30, 2014 compared to $2.4 million on the same date a year ago and $3.7 million at March 31, 2014. Our expanded marketing initiatives, which include close contact with customers plus participation in domestic and international trade shows, remains focused on long-term global growth opportunities.”
Mr. Rooney added, “We are pleased with two recent additions to our Board of Directors that fill vacant positions. Laura F. Shunk was elected to the Board at the Annual Meeting of Shareholders on July 10, 2014, and Emily Lu was appointed to the Board on July 25, 2014. We believe their business experience and skills will further strengthen our Board of Directors.
Laura’s law practice principally involves intellectual property matters including successful execution of advanced material patents. Emily has considerable international experience including serving as Chief Strategy Officer for Solar Power Industries, a vertically integrated manufacturer for photovoltaic solar components with experience in domestic and global markets.”
(1) EBITDA is defined as earnings before interest, income taxes, depreciation and amortization
Total revenue
Total revenue increased approximately 73% to $3,098,376 for the second quarter 2014 from $1,792,775, for the same period a year ago, primarily due to higher sales to core customers.
Gross profit
Gross profit increased 46% to $580,470 for the second quarter 2014 from $398,191 for the same period in 2013 due to higher revenue and product mix. Second quarter 2014 gross profit margin decreased to 18.7% of total revenue from 22.1% the prior year due to increased volume of a high-priced and comparatively low margin raw material used in the manufacture of certain products.
Operating expense
Operating expense (marketing and sales, general and administrative, and R&D expenses) were $511,802 for the three months ended June 30, 2014, compared to $436,822 for the same period last year. The year-over-year increase was primarily due to higher travel expense related to marketing and sales activities, adjustments to the allowance for doubtful accounts, plus higher benefit expense.
Income (Loss) Applicable to Common Stock
Income applicable to common stock was $44,496 or $0.01 per diluted common share for the second quarter 2014, compared to a loss applicable to common stock of $63,602 or $0.02 per basic share for the three months ended June 30, 2014.
EBITDA
Second quarter 2014 EBITDA (Earnings before interest, income taxes, depreciation and amortization) increased to $209,068 from $112,647 for the same period last year. Adjusted EBITDA, which also includes non-cash stock based compensation, was $250,831 for the second quarter 2014 versus $146,943 for the three months ended June 30, 2014.
For the six months ended June 30, 2014, EBITDA increased to $389,425 from $22,694 for the same period last year. Adjusted EBITDA was $474,661 for the first half of 2014 versus $92,425 a year ago.
Cash Provided by (Used in) Operating Activities
Cash provided by operating activities was $511,792 for the six months ended June 30, 2014, compared to cash used in operating activities of $37,311 for the same period last year.
About SCI Engineered Materials, Inc.
SCI Engineered Materials is a global supplier and manufacturer of advanced materials for PVD thin film applications that works closely with end users and OEMs to develop innovative, customized solutions. Additional information is available at www.sciengineeredmaterials.com.
This press release contains certain forward-looking statements within the meaning of Section 27A of the Securities Act of 1933, as amended, and Section 21E of the Securities Exchange Act of 1934, as amended, which are intended to be covered by the safe harbors created thereby. Those statements include, but are not limited to, all statements regarding intent, beliefs, expectations, projections, customer guidance, forecasts, and plans of the Company and its management, and specifically include statements concerning the business which is subject to periodic fluctuations in the price of a high value raw material used in the manufacture of certain products, timing of blanket orders from certain customers, expectations of lower revenue in the third quarter 2014, a return to normal raw material pricing is anticipated late in the third quarter of this year and cautious optimisim concerning increased orders during the second half of 2014 from new customers currently conducting extensive testing and qualification activities and the Company’s focus on long-term global growth opportunities. These forward-looking statements involve numerous risks and uncertainties, including, without limitation, other risks and uncertainties detailed from time to time in the Company’s Securities and Exchange Commission filings, including the Company’s Annual Report on Form 10-K for the year ended December 31, 2013. One or more of these factors have affected, and could in the future affect, the Company’s projections. Therefore, there can be no assurances that the forward-looking statements included in this press release will prove to be accurate. In light of the significant uncertainties in the forward-looking statements included herein, the inclusion of such information should not be regarded as a representation by the Company, or any other persons, that the objectives and plans of the company will be achieved. All forward-looking statements made in this press release are based on information presently available to the management of the Company. The Company assumes no obligation to update any forward-looking statements.
                       SCI ENGINEERED MATERIALS, INC.

                               BALANCE SHEETS

                           ASSETS
                                                   June 30,    December 31,
                                                     2014          2013
                                                 ------------  ------------
                                                  (UNAUDITED)
Current Assets
  Cash                                           $    944,425  $    622,727
  Accounts receivable, less allowance for
   doubtful accounts                                  616,325       634,077
  Inventories                                         969,649     1,709,740
  Prepaid expenses                                     79,522        56,298
                                                 ------------  ------------
    Total current assets                            2,609,921     3,022,842
                                                 ------------  ------------

Property and Equipment, at cost                     7,984,029     7,573,929
  Less accumulated depreciation                    (5,048,126)   (4,781,362)
                                                 ------------  ------------
                                                    2,935,903     2,792,567
                                                 ------------  ------------

Other Assets                                           53,060        55,808
                                                 ------------  ------------

TOTAL ASSETS                                     $  5,598,884  $  5,871,217
                                                 ============  ============


           LIABILITIES AND SHAREHOLDERS' EQUITY

Current Liabilities
  Short term debt                                $    446,354  $    351,689
  Accounts payable                                    420,840       456,111
  Customer deposits                                   472,337     1,105,655
  Accrued expenses                                    200,545       191,487
                                                 ------------  ------------
    Total current liabilities                       1,540,076     2,104,942

  Long term debt                                    1,171,016     1,041,526
                                                 ------------  ------------
    Total liabilities                               2,711,092     3,146,468

Commitments and contingencies

Total Shareholders' Equity                          2,887,792     2,724,749
                                                 ------------  ------------

TOTAL LIABILITIES AND SHAREHOLDERS' EQUITY       $  5,598,884  $  5,871,217
                                                 ============  ============


                       SCI ENGINEERED MATERIALS, INC.
                          Statement of Operations
                                (UNAUDITED)

                    THREE MONTHS ENDED JUNE 30,   SIX MONTHS ENDED JUNE 30,
                         2014          2013          2014          2013
                    -------------  ------------  ------------  ------------

Revenue             $   3,098,376  $  1,792,775  $  5,690,876  $  3,226,377

Cost of revenue         2,517,906     1,394,584     4,523,633     2,654,587
                    -------------  ------------  ------------  ------------

Gross profit              580,470       398,191     1,167,243       571,790

Operating expense         511,802       436,822     1,054,239       901,476
                    -------------  ------------  ------------  ------------

Income (loss) from
 operations                68,668       (38,631)      113,004      (329,686)

Other (expense)
 income                   (17,097)      (18,971)      (33,579)       10,566
                    -------------  ------------  ------------  ------------

Income (loss)
 before provision
 for income taxes          51,571       (57,602)       79,425      (319,120)

Income tax
 (expense) benefit         (1,037)           38        (1,619)            -
                    -------------  ------------  ------------  ------------

Net income (loss)          50,534       (57,564)       77,806      (319,120)

Dividends on
 preferred stock           (6,038)       (6,038)      (12,076)      (12,076)
                    -------------  ------------  ------------  ------------

INCOME (LOSS)
 APPLICABLE TO
 COMMON SHARES      $      44,496  $    (63,602) $     65,730  $   (331,196)
                    =============  ============  ============  ============

Earnings per share
 - basic and
 diluted

Income (loss) per
 common share
  Basic             $        0.01  $      (0.02) $       0.02  $      (0.09)
                    =============  ============  ============  ============
  Diluted           $        0.01  $      (0.02) $       0.02  $      (0.09)
                    =============  ============  ============  ============

Weighted average
 shares outstanding
  Basic                 3,861,222     3,835,997     3,858,575     3,832,964
                    =============  ============  ============  ============
  Diluted               3,861,222     3,835,997     3,858,575     3,832,964
                    =============  ============  ============  ============


                     CONDENSED STATEMENTS OF CASH FLOWS

               FOR THE SIX MONTHS ENDED JUNE 30, 2014 AND 2013

                                                        2014        2013
                                                    ----------- -----------

CASH PROVIDED BY (USED IN):
  Operating activities                              $   511,792 $   (37,311)
  Investing activities                                  (18,085)     34,759
  Financing activities                                 (172,009)   (285,356)
                                                    ----------- -----------
NET INCREASE (DECREASE) IN CASH                         321,698    (287,908)

CASH - Beginning of period                              622,727     630,819
                                                    ----------- -----------

CASH - End of period                                $   944,425 $   342,911
                                                    =========== ===========


                 RECONCILIATION OF GAAP TO NON-GAAP MEASURES

          FOR THE THREE AND SIX MONTHS ENDED JUNE 30, 2014 AND 2013

                     Three months ended June 30,  Six months ended June 30,

                         2014          2013           2014         2013
                     ------------ -------------  ------------ -------------
Net income (loss)    $     50,534 $     (57,564) $     77,806 $    (319,120)
Interest, net              17,346        18,659        33,324        39,122
Income taxes                1,037           (38)        1,619             -
Depreciation and
 amortization             140,151       151,590       276,676       302,692
                     ------------ -------------  ------------ -------------
EBITDA                    209,068       112,647       389,425        22,694

Stock based
 compensation              41,763        34,296        85,236        69,731
                     ------------ -------------  ------------ -------------
Adjusted EBITDA      $    250,831 $     146,943  $    474,661 $      92,425
                     ============ =============  ============ =============